Market Outlook
November 29, 2016
Market Cues
Domestic Indices
Chg (%)
(Pts)
(Close)
Indian market is expected to open on a flat note tracking the SGX Nifty.
BSE Sensex
0.1
34
26,350
The US markets closed lower as markets pulled back from recent highs to
Nifty
0.2
13
8,127
consolidate. Important reports on consumer confidence, personal income and
Mid Cap
1.0
118
12,301
spending, pending home sales, and manufacturing activity are expected later this
Small Cap
0.7
79
12,107
week along with the Federal Reserve's Beige Book. The NYSE Biotechnology Index
Bankex
(1.2)
(245)
20,940
closed down 2.4 percent, while the NYSE Gold Bugs Index closed up by 4.6 percent.
The FTSE moved lower as financials pulled the broader market lower. Royal Bank of
Global Indices
Chg (%)
(Pts)
(Close)
Scotland fell by 2.53 percent while Barclays fell by 1.67 percent. Other banks to lose
Dow Jones
(0.3)
(54)
19,098
ground were Lloyds Banking Group which fell by 1.55 percent and Standard
Chartered which fell by 0.71 percent. Shares of HSBC also lost 1.28 percent.
Nasdaq
(0.6)
(30)
5,369
FTSE
(0.6)
(41)
6,799
Indian markets had a mixed session but ultimately closed positive. Bank stocks in
general and PSU banks in particular gave a weak performance after RBI announced
Nikkei
(0.1)
(24)
18,357
measures to curb excess liquidity by increasing CRR. This move is likely to result in
Hang Seng
0.5
107
22,831
banks having increased borrowing costs and could impact profitability in the
Shanghai Com
0.5
15
3,277
medium term. Bharti Airtel shares rose by 5.9 percent after it announced that it had
acquired Econet Wireless Limited's entire 4.2 percent stake in Airtel Nigeria.
Advances / Declines
BSE
NSE
News Analysis
Advances
1,684
1,053
JSW Steel in talks to buy Italian steel plant
Declines
929
571
Infosys builds update to Finacle aimed at payment banks
Unchanged
169
68
Detailed analysis on Pg2
Volumes (` Cr)
Investor’s Ready Reckoner
BSE
3,012
Key Domestic & Global Indicators
NSE
17,896
Stock Watch: Latest investment recommendations on 150+ stocks
Refer Pg5 onwards
Net Inflows (` Cr)
Net
Mtd
Ytd
Top Picks
FII
(461)
(15,357)
29,658
CMP
Target
Upside
Company
Sector
Rating
(`)
(`)
(%)
MFs
945
11,650
33,703
Amara Raja BatteriesAuto & Auto Ancill.
Buy
925
1,167
26.1
HCL Tech
IT
Buy
803
1,000
24.5
Top Gainers
Price (`)
Chg (%)
Asian Granito
Capital Goods
Buy
198
351
77.6
Mrpl
101
14.9
Equitas Holdings
Financials
Buy
160
235
47.2
Adanipower
27
10.8
Navkar Corporation Others
Buy
178
265
49.0
More Top Picks on Pg3
Aloktext
3
9.5
Jindalstel
71
6.5
Key Upcoming Events
Bel
1,387
6.3
Previous
Consensus
Date
Region
Event Description
Reading
Expectations
Nov 29 US
GDP QoQ (Annualised)
2.9
3.0
Top Losers
Price (`)
Chg (%)
Nov 29 Euro Zone Euro Zone Consumer Confidence
(6.1)
--
Titan
307
(3.3)
Nov 29 US
Consumer Confidence
98.6
101.2
Nov 30 Germany PMI Manufacturing
54.4
--
Ibrealest
68
(3.0)
Dec 1 Euro Zone Euro-Zone Consumer Confidence
(6.10)
(6.10)
Bankbaroda
163
(2.9)
More Events on Pg4
Piind
872
(2.9)
Sbin
254
(2.8)
As on November 28, 2016
Market Outlook
November 29, 2016
News Analysis
JSW Steel in talks to buy Italian steel plant
JSW Steel Ltd has entered into talks to take over Italy's loss-making Ilva steel plant.
Italy's government has been trying to find a bidder for the Ilva plant, Europe's
largest by output capacity, after it was taken over by the government last year in
order to save jobs and clean up its polluting factories.
The world's largest steel producer Arcelor Mittal has also offered to buy Ilva, in a
joint bid with Italian company Marcegaglia.
The sale is expected to be completed in early 2017.
Infosys builds update to Finacle aimed at payment banks
Infosys has built a smaller version of its core banking solution Finacle. This solution
will focus on automation and analytics to assist small banks and payments banks
in India with plans to take the solution to its global customers in the US and
Europe.
Infosys offers what it calls “frictionless banking” that allows users to use their
smartphones to open bank accounts. Infosys has also tied up with Samsung and
mobile app security platform Onegini, in order to secure the on-boarding process.
Paytm has already signed up for the service, and Infosys is in talks with other
banks who have won payment banking licenses.
Infosys plans to generate revenue of $2bln+ in three years from its EdgeVerve
unit, whose main component is Finacle, which offers customised solutions for
banks to run their operations.
Economic and Political News
Central Govt. introduces bill to amend the Income Tax Act in order to impose
tax on unaccounted cash deposits made after demonetisation
A total of 19 SEZs have been notified, to be setup by UP govt.
Central Govt. issues draft of National Software Policy with an aim to increase
share of Indian software products to $148bln and create jobs for 3.5mln
people by 2025
India imports 17.2 lakh tones of wheat YTD due to domestic shortages
Corporate News
Tata Steel negotiating sale of its UK Speciality Steels business for `854cr
Oil India net profit for Q2FY17 dips by 18% YoY to `580cr
S&P affirms rating for State Bank of India at BBB-/A-3 with a stable outlook,
rules out any upgrade for next 18-24 months
Market Outlook
November 29, 2016
Top Picks ★★★★★
Large Cap
Market Cap
CMP
Target
Upside
Company
Rationale
(` Cr)
(`)
(`)
(%)
To outpace battery industry growth due to better
Amara Raja Batteries
15,804
925
1,167
26.1
technological products leading to market share gains in both
the automotive OEM and replacement segments.
The stock is trading at attractive valuations and is factoring
HCL Tech
1,13,305
803
1,000
24.5
all the bad news.
Back on the growth trend; expect a long term growth of 14%
Infosys
2,25,020
980
1,249
27.5
to be a US$20bn in FY2020.
Source: Company, Angel Research
Mid Cap
Market Cap
CMP
Target
Upside
Company
Rationale
(` Cr)
(`)
(`)
(%)
We expect the company would report strong profitability
Asian Granito
595
198
351
77.6
owing to better product mix, higher B2C sales and
amalgamation synergy.
Among the top 4 players in the consumer durables segment.
Bajaj Electricals
2,149
213
274
28.7
Improved profitability backed by turn around in E&P segment.
Strong order book lends earnings visibility.
Favourable outlook for the AC industry to augur well for
Cooling products business which is out pacing the market
Blue Star
4,440
466
634
36.2
growth. EMPPAC division's profitability to improve once
operating environment turns around.
With a focus on the low and medium income (LMI) consumer
Dewan Housing Finance
7,546
241
350
45.2
segment, the company has increased its presence in tier-II &
III cities where the growth opportunity is immense.
Strong loan growth backed by diversified loan portfolio and
Equitas Holdings
5,353
160
235
47.2
adequate CAR. ROE & ROA likely to remain decent as risk of
dilution remains low. Attractive valuations considering growth.
Economic recovery to have favourable impact on advertising
& circulation revenue growth. Further, the acquisition of a
Jagran Prakashan
5,608
172
225
31.1
radio business (Radio City) would also boost the company's
revenue growth.
Speedier execution and speedier sales, strong revenue visibilty
Mahindra Lifespace
1,526
372
522
40.4
in short-to-long run, attractive valuations
We expect the company to report strong growth on back of
healthy growth in domestic branded sales (owing to
Mirza International
964
80
107
33.5
aggressive ad spend and addition in the number of EBOs &
multi-brand outlets [MBOs]) and healthy export revenues.
Massive capacity expansion along with rail advantage at ICD
Navkar Corporation
2,537
178
265
49.0
as well CFS augurs well for the company.
Strong brands and distribution network would boost growth
Siyaram Silk Mills
1,147
1,224
1,605
31.1
going ahead. Stock currently trades at an inexpensive
valuation.
Market leadership in Hindi news genre and no. 2 viewership
ranking in English news genre, exit from the radio business,
TV Today Network
1,845
309
385
24.5
and anticipated growth in ad spends by corporate to benefit
the stock.
Source: Company, Angel Research
Market Outlook
November 29, 2016
Key Upcoming Events
Global economic events release calendar
Bloomberg Data
Date
Time
Country
Event Description
Unit
Period
Last Reported
Estimated
Nov 29, 2016
3:30 PM Euro ZoneEuro-Zone Consumer Confidence
Value Nov F
(6.10)
(6.10)
8:30 PM
US
Consumer ConfidenceS.A./ 1985=100
Nov
98.60
101.20
7:00 PM
US
GDP Qoq (Annualised)
% Change 3Q S
2.90
3.00
Nov 30, 2016
2:25 PM
Germany
Unemployment change (000's)
Thousands
Nov
(13.00)
(5.00)
Dec 01, 2016
3:00 PM
UK
PMI Manufacturing
Value
Nov
54.30
54.20
7:00 PM
US
Initial Jobless claims
Thousands
Nov 26
251.00
2:25 PM
Germany
PMI Manufacturing
Value Nov F
54.40
54.40
6:30 AM
China
PMI Manufacturing
Value
Nov
51.20
51.00
Dec 02, 2016
7:00 PM
US
Change in Nonfarm payrolls
Thousands
Nov
161.00
180.00
7:00 PM
US
Unnemployment rate
% Nov
4.90
4.90
Dec 05, 2016
2:25 PM
Germany
PMI Services
Value Nov F
55.00
Dec 06, 2016
3:30 PM Euro Zone
Euro-Zone GDP s.a. (QoQ)
% Change 3Q F
0.30
Dec 07, 2016
3:00 PM
UK
Industrial Production (YoY)
% Change
Oct
0.30
2:30 PM
India
RBI Reverse Repo rate
% Dec 7
5.75
2:30 PM
India
RBI Repo rate
% Dec 7
6.25
2:30 PM
India
RBI Cash Reserve ratio
% Dec 7
4.00
Dec 08, 2016
6:15 PM Euro Zone
ECB announces interest rates
% Dec 8
-
China
Exports YoY%
% Change Nov
(7.30)
Dec 09, 2016
India
Imports YoY%
% Change Nov
8.10
India
Exports YoY%
% Change Nov
9.59
7:00 AM
China
Consumer Price Index (YoY)
% Change Nov
2.10
Dec 12, 2016
5:30 PM
India
Industrial Production YoY
% Change
Oct
0.70
Dec 13, 2016
3:00 PM
UK
CPI (YoY)
% Change Nov
0.90
7:30 AM
China
Industrial Production (YoY)
% Change Nov
6.10
Source: Bloomberg, Angel Research
Market Outlook
November 29, 2016
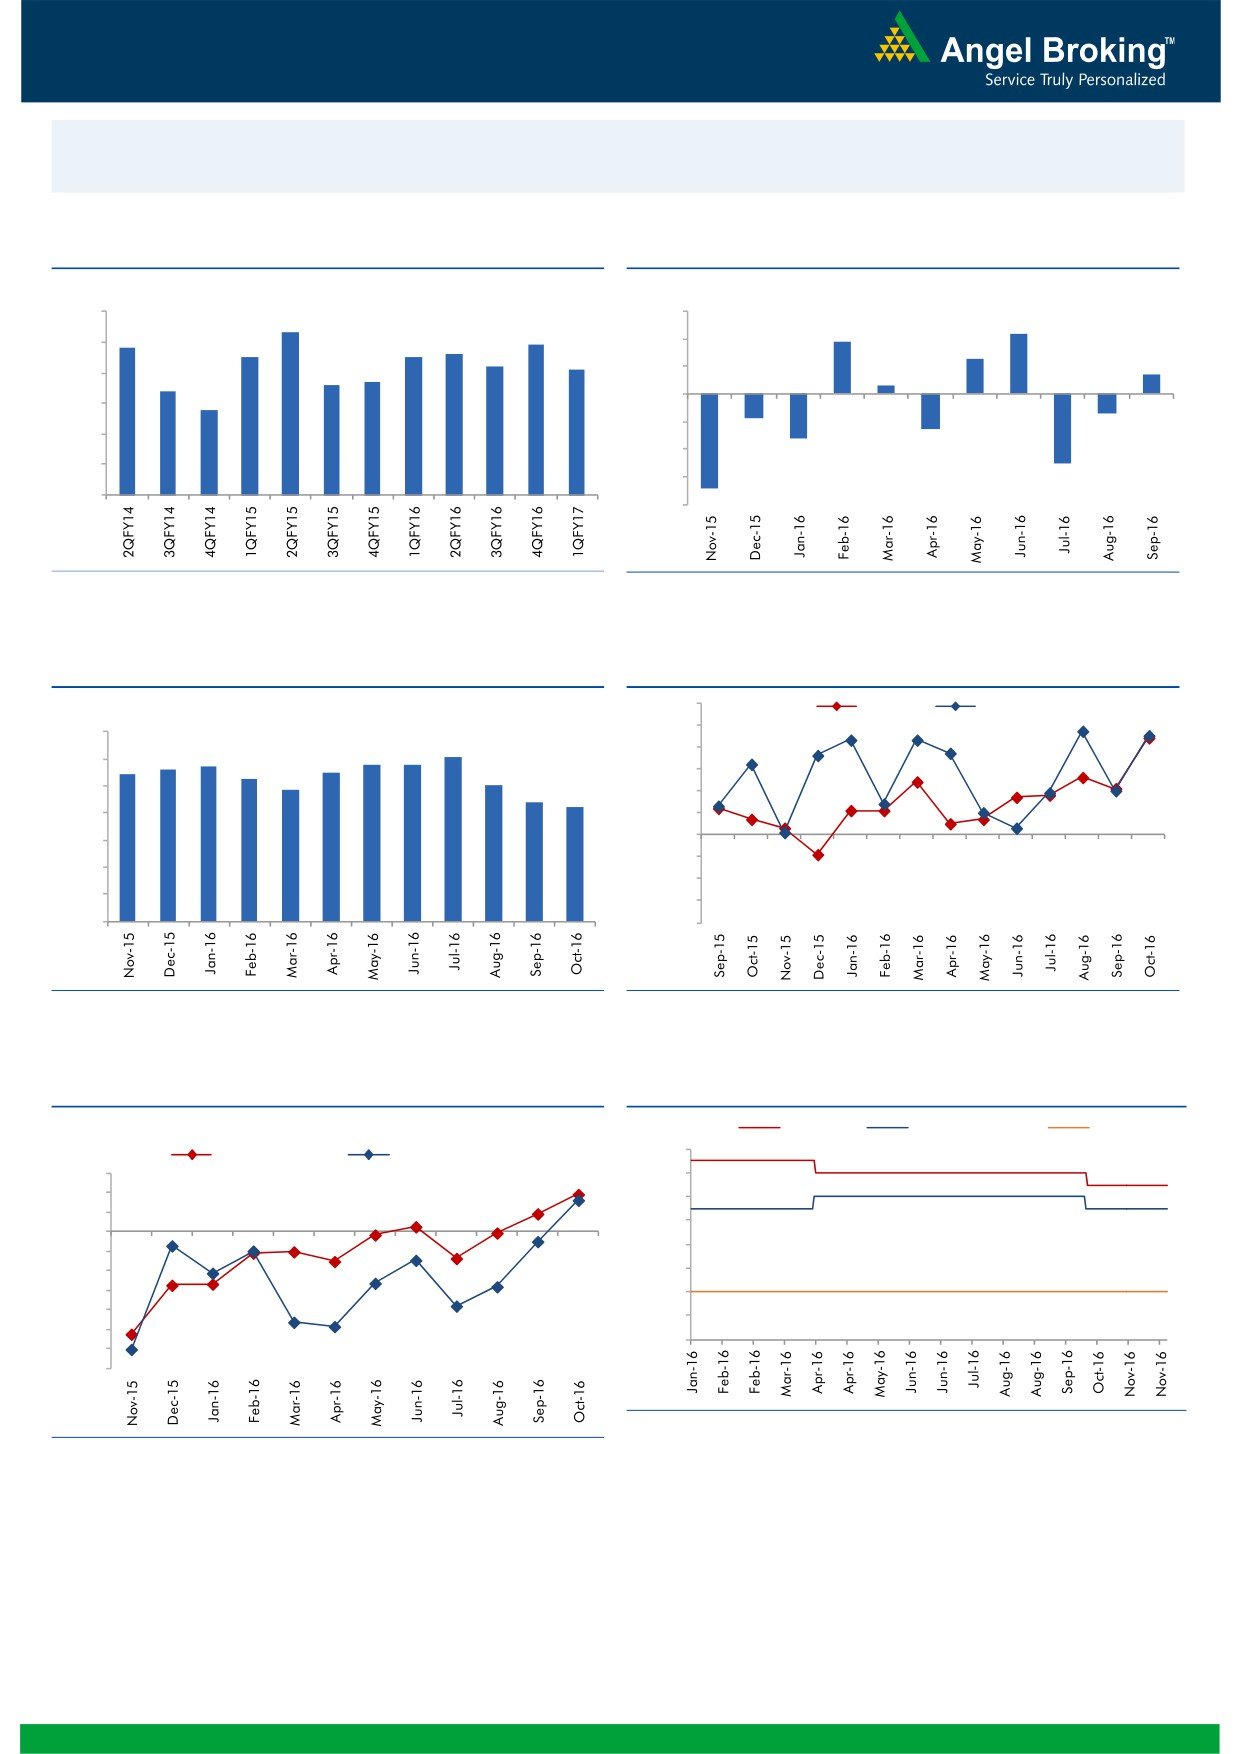
Macro watch
Exhibit 1: Quarterly GDP trends
Exhibit 2: IIP trends
(%)
(%)
9.0
3.0
8.3
2.2
7.9
1.9
7.8
8.0
7.5
7.5
7.6
2.0
1.3
7.2
7.1
0.7
6.6
6.7
1.0
0.3
7.0
6.4
5.8
-
6.0
(1.0)
5.0
(0.7)
(0.9)
(2.0)
(1.3)
(1.6)
4.0
(3.0)
(2.5)
3.0
(4.0)
(3.4)
Source: CSO, Angel Research
Source: MOSPI, Angel Research
Exhibit 3: Monthly CPI inflation trends
Exhibit 4: Manufacturing and services PMI
56.0
Mfg. PMI
Services PMI
(%)
55.0
7.0
6.1
5.7
5.8
5.8
54.0
6.0
5.4
5.6
5.5
5.3
5.1
53.0
4.8
5.0
4.4
4.2
52.0
4.0
51.0
3.0
50.0
49.0
2.0
48.0
1.0
47.0
-
46.0
Source: MOSPI, Angel Research
Source: Market, Angel Research; Note: Level above 50 indicates expansion
Exhibit 5: Exports and imports growth trends
Exhibit 6: Key policy rates
c
(%)
Repo rate
Reverse Repo rate
CRR
7.00
(%)
Exports yoy growth
Imports yoy growth
15.0
6.50
10.0
6.00
5.0
5.50
0.0
5.00
(5.0)
(10.0)
4.50
(15.0)
4.00
(20.0)
3.50
(25.0)
3.00
(30.0)
(35.0)
Source: RBI, Angel Research
Source: Bloomberg, Angel Research
Market Outlook
November 29, 2016
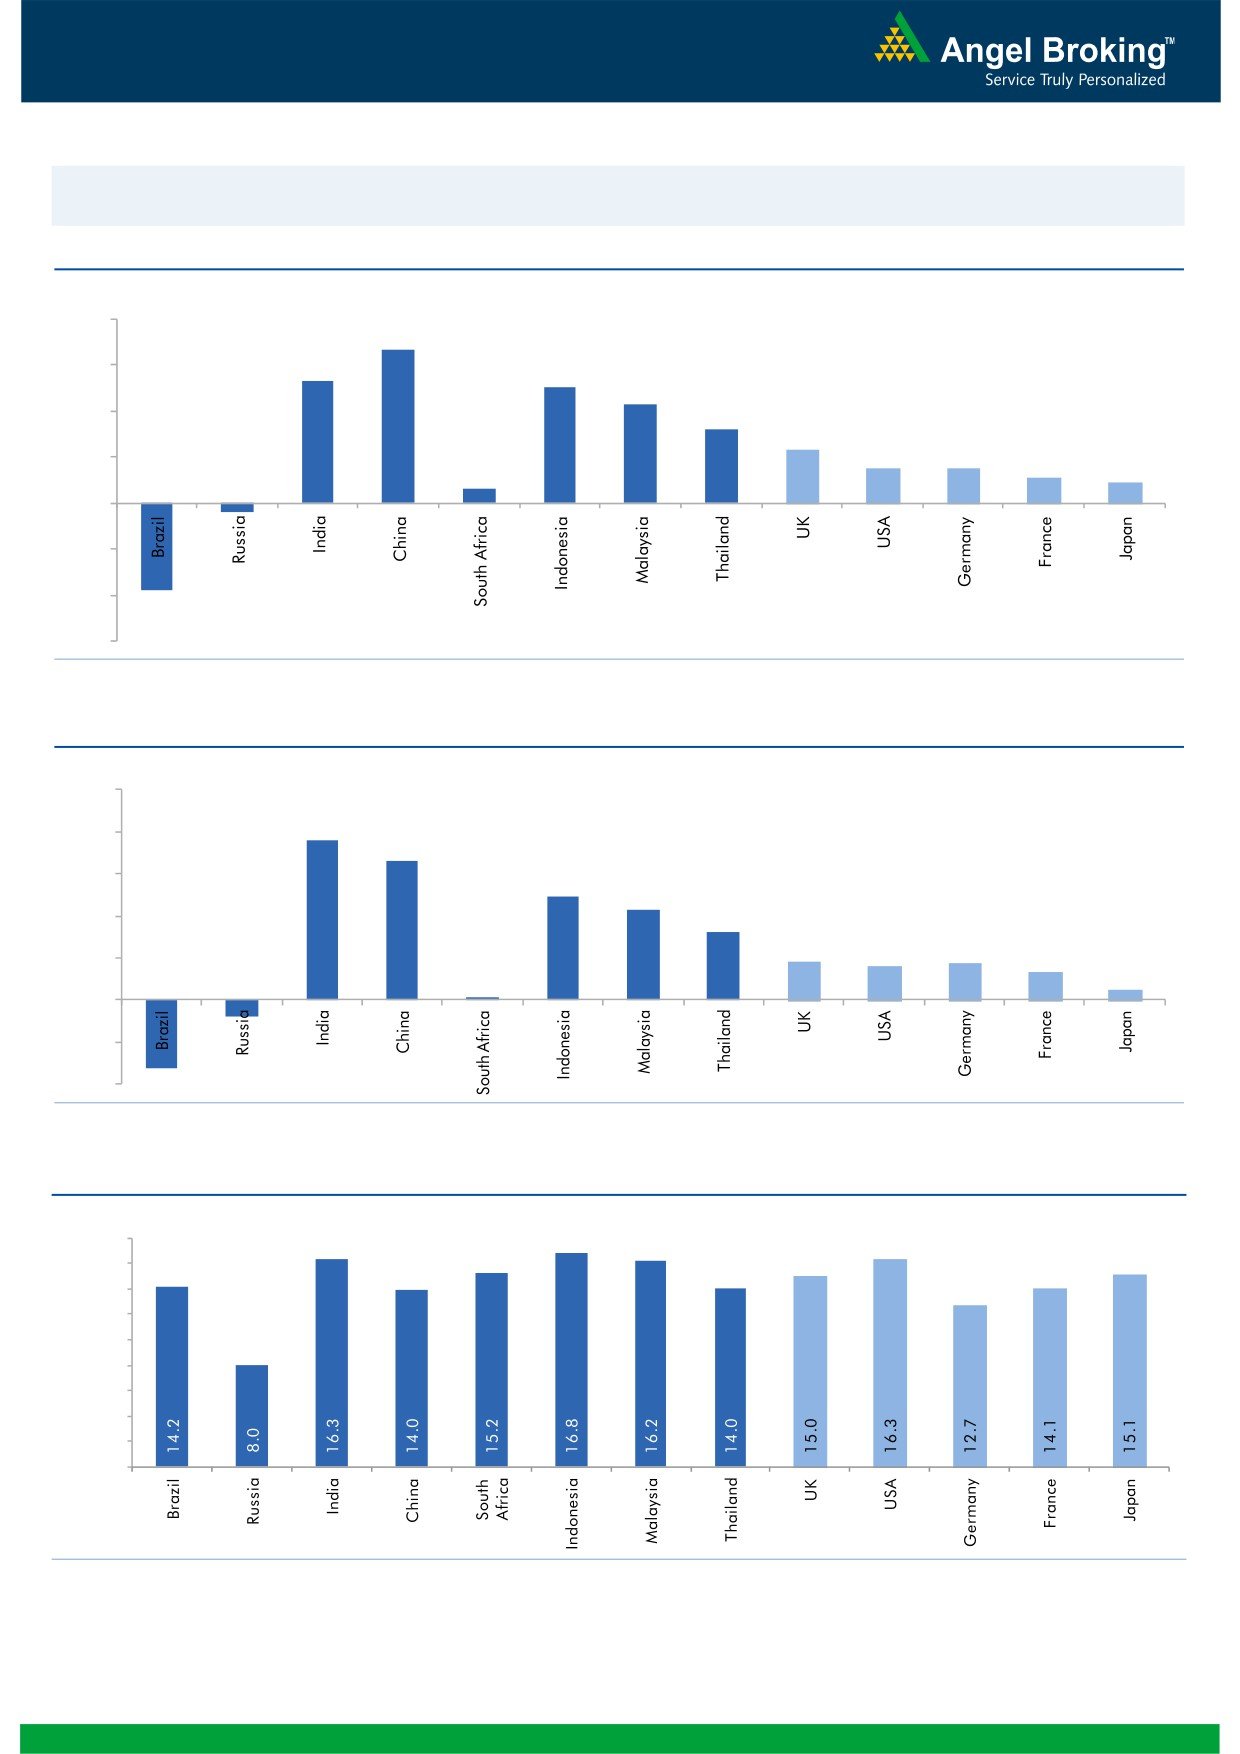
Global watch
Exhibit 1: Latest quarterly GDP Growth (%, yoy) across select developing and developed countries
(%)
8.0
6.7
6.0
5.3
0.6
5.0
4.3
4.0
3.2
2.3
1.5
1.5
2.0
1.1
0.9
-
(2.0)
(0.4)
(4.0)
(3.8)
(6.0)
Source: Bloomberg, Angel Research
Exhibit 2: 2016 GDP Growth projection by IMF (%, yoy) across select developing and developed countries
(%)
10.0
7.6
8.0
6.6
6.0
4.9
4.3
4.0
3.2
1.8
1.7
1.6
1.3
2.0
(0.8)
0.5
(3.3)
0.1
-
(2.0)
(4.0)
Source: IMF, Angel Research
Exhibit 3: One year forward P-E ratio across select developing and developed countries
(x)
18.0
16.0
14.0
12.0
10.0
8.0
6.0
4.0
2.0
-
Source: IMF, Angel Research
Market Outlook
November 29, 2016
Exhibit 4: Relative performance of indices across globe
Returns (%)
Country
Name of index
Closing price
1M
3M
1YR
Brazil
Bovespa
62,856
(1.6)
8.9
30.5
Russia
Micex
2,095
6.1
5.4
14.6
India
Nifty
8,127
(5.7)
(5.9)
3.6
China
Shanghai Composite
3,277
5.3
6.0
(9.6)
South Africa
Top 40
43,617
(2.2)
(6.8)
(7.0)
Mexico
Mexbol
45,471
(5.5)
(4.7)
4.7
Indonesia
LQ45
852
(8.0)
(7.6)
9.6
Malaysia
KLCI
1,629
(2.4)
(3.2)
(2.0)
Thailand
SET 50
935
(0.7)
(4.9)
4.7
USA
Dow Jones
19,098
4.9
3.8
7.8
UK
FTSE
6,799
(2.7)
(0.3)
6.3
Japan
Nikkei
18,357
5.7
11.3
(6.5)
Germany
DAX
10,583
(1.3)
0.4
(6.0)
France
CAC
4,510
(0.5)
1.2
(5.2)
Source: Bloomberg, Angel Research
Stock Watch
November 29, 2016
Company Name
Reco
CMP
Target
Mkt Cap
Sales ( Čcr )
OPM(%)
EPS (Č)
PER(x)
P/BV(x)
RoE(%)
EV/Sales(x)
(Č)
Price ( Č)
( Č cr )
FY17E FY18E
FY17E
FY18E
FY17E
FY18E
FY17E
FY18E
FY17E
FY18E
FY17E
FY18E
FY17E
FY18E
Agri / Agri Chemical
Rallis
Neutral
205
-
3,979
1,937
2,164
13.3
14.3
9.0
11.0
22.7
18.6
4.0
3.5
18.4
19.8
2.1
1.8
United Phosphorus
Accumulate
628
684
31,829
15,176
17,604
18.5
18.5
37.4
44.6
16.8
14.1
3.3
2.7
21.4
21.2
2.2
1.9
Auto & Auto Ancillary
Ashok Leyland
Buy
78
111
22,269
22,407
26,022
10.6
10.6
5.2
6.4
15.0
12.2
3.4
2.9
23.6
24.7
1.1
0.9
Bajaj Auto
Neutral
2,637
-
76,319
25,093
27,891
19.5
19.2
143.9
162.5
18.3
16.2
5.1
4.4
30.3
29.4
2.8
2.4
Bharat Forge
Neutral
908
-
21,133
7,726
8,713
20.5
21.2
35.3
42.7
25.7
21.3
4.8
4.3
18.9
20.1
2.8
2.4
Eicher Motors
Neutral
20,214
-
54,903
16,583
20,447
17.5
18.0
598.0
745.2
33.8
27.1
11.6
8.8
41.2
38.3
3.1
2.5
Gabriel India
Buy
108
130
1,557
1,544
1,715
9.0
9.3
5.4
6.3
20.1
17.2
3.8
3.4
18.9
19.5
1.0
0.9
Hero Motocorp
Accumulate
3,102
3,541
61,933
30,958
34,139
15.7
15.7
193.6
208.3
16.0
14.9
6.3
5.2
34.2
30.5
1.8
1.6
Jamna Auto Industries Neutral
181
-
1,442
1,486
1,620
9.8
9.9
15.0
17.2
12.0
10.5
2.6
2.2
21.8
21.3
1.0
0.9
L G Balakrishnan & Bros Neutral
585
-
918
1,302
1,432
11.6
11.9
43.7
53.0
13.4
11.0
1.9
1.7
13.8
14.2
0.8
0.7
Mahindra and Mahindra Neutral
1,164
-
72,289
46,534
53,077
11.6
11.7
67.3
78.1
17.3
14.9
2.8
2.5
15.4
15.8
1.5
1.3
Maruti
Buy
4,897
6,006
147,932
68,057
82,958
15.8
15.5
212.1
261.2
23.1
18.8
4.6
3.8
19.8
20.3
1.9
1.4
Minda Industries
Neutral
308
-
2,444
2,728
3,042
9.0
9.1
68.2
86.2
4.5
3.6
1.0
0.8
23.8
24.3
1.0
0.8
Motherson Sumi
Neutral
302
-
42,347
45,896
53,687
7.8
8.3
13.0
16.1
23.1
18.7
7.5
6.0
34.7
35.4
1.0
0.8
Rane Brake Lining
Neutral
980
-
776
511
562
11.3
11.5
28.1
30.9
34.9
31.7
5.3
4.8
15.3
15.0
1.7
1.5
Setco Automotive
Neutral
38
-
510
741
837
13.0
13.0
15.2
17.0
2.5
2.2
0.4
0.4
15.8
16.3
1.1
1.0
Tata Motors
Neutral
455
-
131,310
300,209
338,549
8.9
8.4
42.7
54.3
10.7
8.4
1.7
1.4
15.6
17.2
0.6
0.5
TVS Motor
Neutral
354
-
16,809
13,390
15,948
6.9
7.1
12.8
16.5
27.7
21.4
6.9
5.5
26.3
27.2
1.3
1.1
Amara Raja Batteries
Buy
925
1,167
15,804
5,504
6,605
18.4
19.8
33.4
40.9
27.7
22.6
6.1
5.0
22.1
22.0
2.9
2.4
Exide Industries
Neutral
175
-
14,845
7,439
8,307
15.0
15.0
8.1
9.3
21.6
18.8
3.0
2.7
14.3
16.7
1.6
1.4
Apollo Tyres
Buy
182
235
9,257
12,877
14,504
14.3
13.9
21.4
23.0
8.5
7.9
1.3
1.2
16.4
15.2
0.9
0.8
Ceat
Buy
1,195
1,450
4,835
7,524
8,624
13.0
12.7
131.1
144.3
9.1
8.3
1.7
1.4
19.8
18.6
0.7
0.6
JK Tyres
Neutral
118
-
2,674
7,455
8,056
15.0
15.0
21.8
24.5
5.4
4.8
1.1
0.9
22.8
21.3
0.5
0.4
Swaraj Engines
Neutral
1,315
-
1,633
660
810
15.2
16.4
54.5
72.8
24.1
18.1
7.5
6.8
31.5
39.2
2.3
1.8
Subros
Neutral
165
-
990
1,488
1,681
11.7
11.9
6.4
7.2
25.8
23.0
2.7
2.5
10.8
11.4
0.9
0.8
Indag Rubber
Neutral
178
-
467
286
326
19.8
16.8
11.7
13.3
15.2
13.3
2.6
2.4
17.8
17.1
1.3
1.1
Capital Goods
ACE
Neutral
49
-
482
709
814
4.1
4.6
1.4
2.1
34.8
23.2
1.4
1.4
4.4
6.0
0.8
0.7
BEML
Neutral
823
-
3,427
3,451
4,055
6.3
9.2
31.4
57.9
26.2
14.2
1.6
1.4
6.3
10.9
1.1
0.9
Bharat Electronics
Neutral
1,385
-
30,938
8,137
9,169
16.8
17.2
58.7
62.5
23.6
22.2
3.7
3.3
44.6
46.3
2.8
2.5
Stock Watch
November 29, 2016
Company Name
Reco
CMP
Target
Mkt Cap
Sales ( Čcr )
OPM(%)
EPS (Č)
PER(x)
P/BV(x)
RoE(%)
EV/Sales(x)
(Č)
Price ( Č)
( Č cr )
FY17E
FY18E
FY17E
FY18E
FY17E
FY18E
FY17E
FY18E
FY17E
FY18E
FY17E
FY18E
FY17E
FY18E
Capital Goods
Voltas
Buy
301
407
9,945
6,511
7,514
7.9
8.7
12.9
16.3
23.3
18.4
4.2
3.7
16.7
18.5
1.3
1.1
BGR Energy
Neutral
109
-
783
16,567
33,848
6.0
5.6
7.8
5.9
13.9
18.4
0.8
0.8
4.7
4.2
0.1
0.1
BHEL
Neutral
128
-
31,244
28,797
34,742
-
2.8
2.3
6.9
55.5
18.5
0.9
0.9
1.3
4.8
0.7
0.5
Blue Star
Buy
466
634
4,440
4,283
5,077
5.9
7.3
14.9
22.1
31.3
21.0
6.1
5.1
20.4
26.4
1.1
0.9
Crompton Greaves
Neutral
73
-
4,585
5,777
6,120
5.9
7.0
3.3
4.5
22.2
16.3
1.0
0.9
4.4
5.9
0.8
0.6
Greaves Cotton
Neutral
125
-
3,051
1,755
1,881
16.8
16.9
7.8
8.5
16.0
14.7
3.2
3.0
20.6
20.9
1.4
1.3
Inox Wind
Neutral
183
-
4,051
5,605
6,267
15.7
16.4
24.8
30.0
7.4
6.1
2.1
1.5
25.9
24.4
0.8
0.6
KEC International
Neutral
141
-
3,628
9,294
10,186
7.9
8.1
9.9
11.9
14.3
11.9
2.1
1.8
15.6
16.3
0.6
0.6
Thermax
Neutral
829
-
9,874
5,421
5,940
7.3
7.3
25.7
30.2
32.3
27.4
3.9
3.6
12.2
13.1
1.7
1.6
VATech Wabag
Buy
496
681
2,704
3,136
3,845
8.9
9.1
26.0
35.9
19.1
13.8
2.4
2.0
13.4
15.9
0.8
0.6
Cement
ACC
Neutral
1,315
-
24,691
11,225
13,172
13.2
16.9
44.5
75.5
29.6
17.4
2.8
2.6
11.2
14.2
2.2
1.9
Ambuja Cements
Neutral
204
-
40,547
9,350
10,979
18.2
22.5
5.8
9.5
35.2
21.5
3.0
2.7
10.2
12.5
4.3
3.7
India Cements
Neutral
118
-
3,619
4,364
4,997
18.5
19.2
7.9
11.3
14.9
10.4
1.1
1.0
8.0
8.5
1.6
1.4
JK Cement
Neutral
710
-
4,967
4,398
5,173
15.5
17.5
31.2
55.5
22.8
12.8
2.7
2.4
12.0
15.5
1.7
1.4
J K Lakshmi Cement
Buy
379
565
4,457
2,913
3,412
14.5
19.5
7.5
22.5
50.5
16.8
3.1
2.6
12.5
18.0
2.1
1.8
Orient Cement
Buy
133
215
2,715
2,114
2,558
18.5
20.5
8.1
11.3
16.4
11.7
2.4
2.0
9.0
14.0
1.9
1.5
UltraTech Cement
Neutral
3,503
-
96,136
25,768
30,385
21.0
23.5
111.0
160.0
31.6
21.9
4.0
3.5
13.5
15.8
3.8
3.2
Construction
ITNL
Neutral
99
-
3,252
8,946
10,017
31.0
31.6
8.1
9.1
12.2
10.9
0.5
0.5
4.2
5.0
3.7
3.4
KNR Constructions
Accumulate
725
802
2,038
1,385
1,673
14.7
14.0
41.2
48.5
17.6
14.9
3.3
2.8
14.9
15.2
1.6
1.3
Larsen & Toubro
Buy
1,356
1,700
126,394
67,665
77,249
10.7
11.5
57.3
71.2
23.7
19.1
2.2
2.0
12.6
14.3
2.0
1.8
Gujarat Pipavav Port
Neutral
146
-
7,046
705
788
52.2
51.7
5.0
5.6
29.2
26.0
2.9
2.6
11.2
11.2
9.6
8.1
Nagarjuna Const.
Neutral
78
-
4,359
8,842
9,775
9.1
8.8
5.3
6.4
14.8
12.3
1.2
1.1
8.2
9.1
0.7
0.6
PNC Infratech
Buy
110
143
2,825
2,350
2,904
13.1
13.2
9.0
8.8
12.2
12.5
0.5
0.4
15.9
13.9
1.3
1.1
Simplex Infra
Neutral
316
-
1,565
6,829
7,954
10.5
10.5
31.4
37.4
10.1
8.5
1.0
1.0
9.9
13.4
0.7
0.6
Power Mech Projects
Neutral
465
-
685
1,801
2,219
12.7
14.6
72.1
113.9
6.5
4.1
1.2
1.0
16.8
11.9
0.4
0.3
Sadbhav Engineering
Accumulate
270
298
4,631
3,598
4,140
10.3
10.6
9.0
11.9
30.0
22.7
3.1
2.8
9.9
11.9
1.6
1.3
NBCC
Neutral
227
-
13,620
7,428
9,549
7.9
8.6
8.2
11.0
27.7
20.6
1.4
1.1
28.2
28.7
1.5
1.1
MEP Infra
Neutral
36
-
584
1,877
1,943
30.6
29.8
3.0
4.2
12.0
8.6
5.8
3.9
0.6
0.6
1.7
1.5
SIPL
Neutral
88
-
3,082
1,036
1,252
65.5
66.2
(8.4)
(5.6)
3.3
3.7
(22.8)
(15.9)
11.2
9.3
Stock Watch
November 29, 2016
Company Name
Reco
CMP
Target
Mkt Cap
Sales ( Čcr )
OPM(%)
EPS (Č)
PER(x)
P/BV(x)
RoE(%)
EV/Sales(x)
(Č)
Price ( Č)
( Č cr )
FY17E
FY18E
FY17E
FY18E
FY17E
FY18E
FY17E
FY18E
FY17E
FY18E
FY17E
FY18E
FY17E
FY18E
Construction
Engineers India
Neutral
293
-
9,855
1,725
1,935
16.0
19.1
11.4
13.9
25.7
21.0
3.5
3.4
13.4
15.3
4.6
4.2
Financials
Axis Bank
Buy
473
630
112,846
46,932
53,575
3.5
3.4
32.4
44.6
14.6
10.6
1.9
1.6
13.6
16.5
-
-
Bank of Baroda
Neutral
163
-
37,546
19,980
23,178
1.8
1.8
11.5
17.3
14.2
9.4
1.6
1.3
8.3
10.1
-
-
Canara Bank
Neutral
309
-
16,795
15,225
16,836
1.8
1.8
14.5
28.0
21.3
11.1
1.5
1.2
5.8
8.5
-
-
Dewan Housing Finance Buy
241
350
7,546
2,225
2,688
2.9
2.9
29.7
34.6
8.1
7.0
1.3
1.1
16.1
16.8
-
-
Equitas Holdings
Buy
160
235
5,353
939
1,281
11.7
11.5
5.8
8.2
27.5
19.5
2.4
2.1
10.9
11.5
-
-
Federal Bank
Neutral
70
-
12,010
9,353
10,623
2.9
2.9
4.4
5.8
15.9
12.1
1.5
1.3
9.5
11.0
-
-
HDFC
Neutral
1,247
-
197,186
11,475
13,450
3.4
3.4
45.3
52.5
27.5
23.8
5.3
4.7
20.2
20.5
-
-
HDFC Bank
Accumulate
1,185
1,350
300,100
46,097
55,433
4.5
4.5
58.4
68.0
20.3
17.4
3.6
3.0
18.8
18.6
-
-
ICICI Bank
Buy
255
315
148,592
42,800
44,686
3.1
3.3
18.0
21.9
14.2
11.7
1.9
1.8
11.1
12.3
-
-
LIC Housing Finance
Buy
539
630
27,216
3,712
4,293
2.6
2.5
39.0
46.0
13.8
11.7
2.6
2.2
19.9
20.1
-
-
Punjab Natl.Bank
Neutral
137
-
29,185
23,532
23,595
2.3
2.4
6.8
12.6
20.2
10.9
3.1
2.2
3.3
6.5
-
-
RBL Bank
Neutral
353
-
13,062
1,783
2,309
2.6
2.6
12.7
16.4
27.8
21.5
3.0
2.7
12.8
13.3
-
-
South Ind.Bank
Neutral
21
-
2,829
6,435
7,578
2.5
2.5
2.7
3.1
7.8
6.8
1.0
0.8
10.1
11.2
-
-
St Bk of India
Neutral
254
-
196,864
88,650
98,335
2.6
2.6
13.5
18.8
18.8
13.5
1.8
1.6
7.0
8.5
-
-
Union Bank
Neutral
150
-
10,308
13,450
14,925
2.3
2.3
25.5
34.5
5.9
4.4
0.9
0.7
7.5
10.2
-
-
Yes Bank
Neutral
1,149
-
48,371
8,978
11,281
3.3
3.4
74.0
90.0
15.5
12.8
3.0
2.5
17.0
17.2
-
-
FMCG
Asian Paints
Neutral
938
-
89,973
17,128
18,978
16.8
16.4
19.1
20.7
49.1
45.3
17.1
16.1
34.8
35.5
5.2
4.7
Britannia
Buy
2,958
3,626
35,483
9,594
11,011
14.6
14.9
80.3
94.0
36.8
31.5
15.1
11.7
41.2
-
3.6
3.1
Colgate
Accumulate
931
995
25,322
4,605
5,149
23.4
23.4
23.8
26.9
39.1
34.6
21.7
16.9
64.8
66.8
5.4
4.8
Dabur India
Accumulate
277
304
48,719
8,315
9,405
19.8
20.7
8.1
9.2
34.2
30.1
9.5
7.9
31.6
31.0
5.5
4.8
GlaxoSmith Con*
Neutral
5,015
-
21,091
4,350
4,823
21.2
21.4
179.2
196.5
28.0
25.5
7.4
6.3
27.1
26.8
4.2
3.7
Godrej Consumer
Neutral
1,437
-
48,921
10,235
11,428
18.4
18.6
41.1
44.2
35.0
32.5
7.8
6.5
24.9
24.8
4.9
4.3
HUL
Neutral
837
-
181,202
35,252
38,495
17.8
17.8
20.7
22.4
40.6
37.4
38.8
33.2
95.6
88.9
5.0
4.6
ITC
Buy
234
284
281,853
40,059
44,439
38.3
39.2
9.0
10.1
26.0
23.0
7.3
6.3
27.8
27.5
6.5
5.9
Marico
Buy
250
300
32,267
6,430
7,349
18.8
19.5
6.4
7.7
39.1
32.5
11.8
9.9
33.2
32.5
4.8
4.2
Nestle*
Neutral
6,291
-
60,659
10,073
11,807
20.7
21.5
124.8
154.2
50.4
40.8
20.7
18.6
34.8
36.7
5.8
5.0
Tata Global
Neutral
121
-
7,634
8,675
9,088
9.8
9.8
7.4
8.2
16.3
14.8
1.9
1.8
7.9
8.1
0.8
0.7
Procter & Gamble
Accumulate
6,596
7,369
21,413
2,939
3,342
23.2
23.0
146.2
163.7
45.1
40.3
101.0
96.9
25.3
23.5
6.8
5.9
Hygiene
Stock Watch
November 29, 2016
Company Name
Reco
CMP
Target
Mkt Cap
Sales ( Čcr )
OPM(%)
EPS (Č)
PER(x)
P/BV(x)
RoE(%)
EV/Sales(x)
(Č)
Price ( Č)
( Č cr )
FY17E FY18E
FY17E
FY18E
FY17E
FY18E
FY17E
FY18E
FY17E
FY18E
FY17E
FY18E
FY17E
FY18E
IT
HCL Tech^
Buy
803
1,000
113,305
49,242
57,168
20.5
20.5
55.7
64.1
14.4
12.5
2.9
2.2
20.3
17.9
2.2
1.8
Infosys
Buy
980
1,249
225,020
68,350
77,326
27.0
27.0
62.5
69.4
15.7
14.1
3.3
3.1
21.3
21.6
2.7
2.4
TCS
Buy
2,277
2,620
448,726
119,025
133,308
27.6
27.6
131.2
145.5
17.4
15.7
5.6
5.2
32.4
33.1
3.5
3.1
Tech Mahindra
Buy
488
600
47,395
29,673
32,937
15.5
17.0
32.8
39.9
14.9
12.2
2.9
2.5
19.6
20.7
1.3
1.1
Wipro
Buy
461
590
112,166
55,440
60,430
18.1
18.1
35.9
39.9
12.9
11.6
2.3
2.1
19.0
19.3
1.7
1.6
Media
D B Corp
Neutral
365
-
6,707
2,297
2,590
27.4
28.2
21.0
23.4
17.4
15.6
4.1
3.5
23.7
23.1
2.7
2.3
HT Media
Neutral
72
-
1,665
2,693
2,991
12.6
12.9
7.9
9.0
9.1
8.0
0.8
0.7
7.8
8.3
0.2
0.1
Jagran Prakashan
Buy
172
225
5,608
2,355
2,635
28.0
28.0
10.8
12.5
15.9
13.7
3.4
3.0
21.7
21.7
2.4
2.1
Sun TV Network
Neutral
461
-
18,167
2,850
3,265
70.1
71.0
26.2
30.4
17.6
15.2
4.5
4.0
24.3
25.6
6.0
5.1
Hindustan Media
Neutral
269
-
1,976
1,016
1,138
24.3
25.2
27.3
30.1
9.9
9.0
1.9
1.7
16.2
15.8
1.3
1.1
Ventures
TV Today Network
Buy
311
385
1,858
637
743
27.5
27.5
18.4
21.4
16.9
14.6
3.0
2.5
17.4
17.2
2.5
2.0
Metals & Mining
Coal India
Neutral
305
-
192,491
84,638
94,297
21.4
22.3
24.5
27.1
12.4
11.3
5.2
4.9
42.6
46.0
1.8
1.6
Hind. Zinc
Neutral
284
-
120,147
14,252
18,465
55.9
48.3
15.8
21.5
18.0
13.2
2.9
2.6
17.0
20.7
8.4
6.5
Hindalco
Neutral
179
-
36,870
107,899
112,095
7.4
8.2
9.2
13.0
19.4
13.7
0.9
0.9
4.8
6.6
0.9
0.8
JSW Steel
Neutral
1,723
-
41,657
53,201
58,779
16.1
16.2
130.6
153.7
13.2
11.2
1.8
1.6
14.0
14.4
1.5
1.3
NMDC
Neutral
123
-
38,789
6,643
7,284
44.4
47.7
7.1
7.7
17.3
15.9
1.5
1.5
8.8
9.2
3.6
3.2
SAIL
Neutral
51
-
21,249
47,528
53,738
(0.7)
2.1
(1.9)
2.6
19.8
0.6
0.5
(1.6)
3.9
1.3
1.2
Vedanta
Neutral
229
-
67,773
71,744
81,944
19.2
21.7
13.4
20.1
17.1
11.4
1.5
1.3
8.4
11.3
1.3
1.0
Tata Steel
Neutral
407
-
39,538
121,374
121,856
7.2
8.4
18.6
34.3
21.9
11.9
1.4
1.3
6.1
10.1
1.0
0.9
Oil & Gas
Cairn India
Neutral
250
-
46,806
9,127
10,632
4.3
20.6
8.8
11.7
28.4
21.3
0.9
0.9
3.3
4.2
6.6
5.5
GAIL
Neutral
417
-
52,946
56,220
65,198
9.3
10.1
27.1
33.3
15.4
12.5
1.4
1.3
9.3
10.7
1.1
1.0
ONGC
Neutral
284
-
242,976
137,222
152,563
15.0
21.8
19.5
24.1
14.6
11.8
1.3
1.2
8.5
10.1
2.1
1.8
Indian Oil Corp
Neutral
300
-
145,750
373,359
428,656
5.9
5.5
54.0
59.3
5.6
5.1
0.9
0.8
16.0
15.6
0.5
0.5
Reliance Industries
Neutral
986
-
319,851
301,963
358,039
12.1
12.6
87.7
101.7
11.3
9.7
1.2
1.1
10.7
11.3
1.5
1.3
Pharmaceuticals
Alembic Pharma
Neutral
649
-
12,241
3,483
4,083
20.2
21.4
24.3
30.4
26.7
21.4
6.1
4.9
25.5
25.3
3.5
2.9
Aurobindo Pharma
Buy
736
877
43,063
15,720
18,078
23.7
23.7
41.4
47.3
17.8
15.6
4.6
3.6
29.6
26.1
3.0
2.6
Aventis*
Neutral
4,322
-
9,955
2,277
2,597
17.3
18.3
149.4
172.0
28.9
25.1
4.8
3.9
25.1
28.8
4.0
3.3
Cadila Healthcare
Neutral
411
-
42,076
10,429
12,318
22.6
22.0
16.9
19.2
24.3
21.4
6.2
5.0
28.5
25.7
4.0
3.3
Cipla
Reduce
571
490
45,848
15,378
18,089
17.4
18.4
21.6
27.2
26.4
21.0
3.4
3.0
13.7
15.2
3.2
2.7
Stock Watch
November 29, 2016
Company Name
Reco
CMP
Target
Mkt Cap
Sales ( Čcr )
OPM(%)
EPS (Č)
PER(x)
P/BV(x)
RoE(%)
EV/Sales(x)
(Č)
Price ( Č)
( Č cr )
FY17E FY18E
FY17E
FY18E
FY17E
FY18E
FY17E
FY18E
FY17E
FY18E
FY17E
FY18E
FY17E
FY18E
Pharmaceuticals
Dr Reddy's
Neutral
3,176
-
52,623
16,043
18,119
20.8
22.4
112.4
142.9
28.3
22.2
3.8
3.3
14.1
15.9
3.3
2.9
Dishman Pharma
Neutral
240
-
3,868
1,718
1,890
22.7
22.8
9.5
11.3
25.2
21.2
2.4
2.2
10.1
10.9
2.7
2.4
GSK Pharma*
Neutral
2,721
-
23,046
3,000
3,312
15.4
20.6
46.5
60.8
58.5
44.8
14.1
14.0
26.3
30.6
7.4
6.8
Indoco Remedies
Reduce
275
240
2,531
1,112
1,289
16.2
18.2
11.6
16.0
23.7
17.2
3.8
3.2
17.0
20.1
2.4
2.0
Ipca labs
Accumulate
569
613
7,178
3,303
3,799
15.3
15.3
17.3
19.7
32.9
28.9
2.9
2.6
9.1
9.4
2.3
2.0
Lupin
Buy
1,505
1,809
67,840
15,912
18,644
26.4
26.7
58.1
69.3
25.9
21.7
5.0
4.1
21.4
20.9
4.3
3.6
Sun Pharma
Buy
714
847
171,790
31,129
35,258
32.0
32.9
30.2
35.3
23.6
20.2
3.9
3.2
20.0
20.1
5.1
4.3
Power
Tata Power
Neutral
73
-
19,663
36,916
39,557
17.4
27.1
5.1
6.3
14.3
11.5
1.3
1.2
9.0
10.3
1.5
1.4
NTPC
Neutral
164
-
135,473
86,605
95,545
17.5
20.8
11.8
13.4
13.9
12.3
1.4
1.3
10.5
11.1
2.9
2.9
Power Grid
Neutral
191
-
99,923
25,763
29,762
74.3
73.1
14.8
17.3
12.9
11.0
2.0
1.8
16.9
17.5
8.2
7.7
Real Estate
Prestige Estate
Buy
156
210
5,833
4,707
5,105
25.2
26.0
10.3
13.0
15.1
12.0
1.2
1.1
10.3
10.2
2.4
2.1
MLIFE
Buy
372
522
1,526
1,152
1,300
22.7
24.6
29.9
35.8
12.4
10.4
0.9
0.9
7.6
8.6
2.0
1.7
Telecom
Bharti Airtel
Neutral
318
-
126,917
105,086
114,808
34.5
34.7
12.2
16.4
26.0
19.4
1.8
1.6
6.8
8.4
2.1
1.8
Idea Cellular
Neutral
76
-
27,294
40,133
43,731
37.2
37.1
6.4
6.5
11.8
11.7
1.0
0.9
8.2
7.6
1.7
1.4
zOthers
Abbott India
Neutral
4,925
-
10,466
3,153
3,583
14.1
14.4
152.2
182.7
32.4
27.0
158.9
135.7
25.6
26.1
3.0
2.6
Asian Granito
Buy
198
351
595
1,071
1,182
12.1
12.4
12.7
16.0
15.5
12.4
1.5
1.3
9.5
10.7
0.9
0.7
Bajaj Electricals
Buy
213
274
2,149
4,801
5,351
5.7
6.2
10.4
13.7
20.4
15.5
2.5
2.3
12.4
14.5
0.4
0.4
Banco Products (India)
Neutral
182
-
1,301
1,353
1,471
12.3
12.4
14.5
16.3
12.6
11.2
17.3
15.6
14.5
14.6
0.9
96.4
Coffee Day Enterprises
Neutral
206
-
4,233
2,964
3,260
20.5
21.2
4.7
8.0
-
25.7
2.4
2.2
5.5
8.5
1.8
1.6
Ltd
Competent Automobiles Neutral
159
-
98
1,137
1,256
3.1
2.7
28.0
23.6
5.7
6.7
30.6
27.6
14.3
11.5
0.1
0.1
Elecon Engineering
Neutral
52
-
569
1,482
1,660
13.7
14.5
3.9
5.8
13.4
9.0
3.2
2.9
7.8
10.9
0.7
0.6
Finolex Cables
Neutral
404
-
6,173
2,883
3,115
12.0
12.1
14.2
18.6
28.4
21.7
15.1
13.2
15.8
14.6
1.8
1.7
Garware Wall Ropes
Neutral
613
-
1,341
873
938
14.3
14.3
35.2
37.5
17.4
16.4
3.1
2.6
17.5
15.9
1.4
1.3
Goodyear India*
Neutral
733
-
1,692
1,598
1,704
10.4
10.2
49.4
52.6
14.9
13.9
68.5
60.1
18.2
17.0
0.7
103.7
Hitachi
Neutral
1,371
-
3,727
2,081
2,433
8.8
8.9
33.4
39.9
41.0
34.4
33.1
27.6
22.1
21.4
1.8
1.5
HSIL
Neutral
302
-
2,180
2,384
2,515
15.8
16.3
15.3
19.4
19.7
15.5
19.6
16.9
7.8
9.3
1.1
1.0
Interglobe Aviation
Neutral
888
-
32,003
21,122
26,005
14.5
27.6
110.7
132.1
8.0
6.7
48.0
34.3
168.5
201.1
1.5
1.2
Jyothy Laboratories
Neutral
339
-
6,164
1,440
2,052
11.5
13.0
8.5
10.0
39.9
34.0
9.7
9.0
18.6
19.3
4.6
3.2
Kirloskar Engines India
Neutral
325
-
4,700
2,554
2,800
9.9
10.0
10.5
12.1
31.0
26.9
13.0
12.2
10.7
11.7
1.5
1.3
Ltd
Stock Watch
November 29, 2016
Company Name
Reco
CMP
Target
Mkt Cap
Sales ( Čcr )
OPM(%)
EPS (Č)
PER(x)
P/BV(x)
RoE(%)
EV/Sales(x)
(Č)
Price ( Č)
( Č cr )
FY17E
FY18E
FY17E
FY18E
FY17E
FY18E
FY17E
FY18E
FY17E
FY18E
FY17E
FY18E
FY17E
FY18E
zOthers
Linc Pen & Plastics
Neutral
235
-
347
382
420
9.3
9.5
13.5
15.7
17.4
14.9
3.0
2.6
17.1
17.3
1.0
0.9
M M Forgings
Neutral
432
-
522
546
608
20.4
20.7
41.3
48.7
10.5
8.9
59.2
52.4
16.6
17.0
0.8
0.7
Manpasand Bever.
Neutral
620
-
3,546
836
1,087
19.6
19.4
16.9
23.8
36.7
26.0
4.4
3.9
12.0
14.8
4.0
3.0
Mirza International
Buy
80
107
964
987
1,106
18.0
18.0
6.5
7.6
12.3
10.5
2.0
1.7
15.9
15.7
1.2
1.0
MT Educare
Neutral
114
-
455
366
417
17.7
18.2
9.4
10.8
12.2
10.6
2.7
2.4
22.2
22.3
1.1
1.0
Narayana Hrudaya
Neutral
343
-
7,010
1,873
2,166
11.5
11.7
2.6
4.0
129.7
86.5
8.0
7.2
6.1
8.3
3.8
3.3
Navkar Corporation
Buy
176
265
2,504
408
612
42.9
42.3
6.8
11.5
25.9
15.3
1.8
1.6
6.9
10.5
7.1
4.8
Navneet Education
Neutral
107
-
2,551
1,062
1,147
24.0
24.0
6.1
6.6
17.6
16.2
3.6
3.2
20.6
19.8
2.5
2.3
Nilkamal
Neutral
1,405
-
2,096
1,995
2,165
10.7
10.4
69.8
80.6
20.1
17.4
80.3
69.7
16.6
16.5
1.0
0.9
Page Industries
Neutral
12,814
-
14,293
2,450
3,124
20.1
17.6
299.0
310.0
42.9
41.3
285.4
217.9
47.1
87.5
5.9
4.6
Parag Milk Foods
Neutral
271
-
2,281
1,919
2,231
9.3
9.6
9.5
12.9
28.7
21.0
4.5
3.7
15.5
17.5
1.3
1.1
Quick Heal
Neutral
235
-
1,645
408
495
27.3
27.0
7.7
8.8
30.3
26.7
2.8
2.8
9.3
10.6
3.2
2.6
Radico Khaitan
Buy
117
147
1,559
1,667
1,824
13.0
13.2
6.7
8.2
17.6
14.3
1.6
1.5
9.0
10.2
1.3
1.2
Relaxo Footwears
Neutral
414
-
4,972
2,085
2,469
9.2
8.2
7.6
8.0
54.8
52.1
21.2
18.1
17.9
18.8
2.5
2.1
S H Kelkar & Co.
Neutral
297
-
4,289
1,036
1,160
15.1
15.0
6.1
7.2
48.6
41.3
5.2
4.8
10.7
11.5
4.0
3.5
Siyaram Silk Mills
Accumulate
1,224
1,605
1,147
1,733
1,948
11.6
11.7
96.6
114.7
12.7
10.7
1.9
1.7
15.3
15.7
0.9
0.8
Styrolution ABS India*
Neutral
599
-
1,053
1,440
1,537
9.2
9.0
40.6
42.6
14.8
14.1
37.7
34.2
12.3
11.6
0.7
0.6
Surya Roshni
Neutral
197
-
865
3,342
3,625
7.8
7.5
17.3
19.8
11.4
10.0
21.7
17.4
10.5
10.8
0.5
0.5
Team Lease Serv.
Neutral
847
-
1,449
3,229
4,001
1.5
1.8
22.8
32.8
37.2
25.8
4.0
3.5
10.7
13.4
0.4
0.3
The Byke Hospitality
Neutral
174
-
699
287
384
20.5
20.5
7.6
10.7
22.9
16.3
4.8
3.9
20.7
23.5
2.4
1.8
Transport Corporation of
Neutral
179
-
1,372
2,671
2,911
8.5
8.8
13.9
15.7
12.9
11.4
1.8
1.6
13.7
13.8
0.6
0.6
India
TVS Srichakra
Neutral
3,394
-
2,599
2,304
2,614
13.7
13.8
231.1
266.6
14.7
12.7
381.3
300.3
33.9
29.3
1.1
1.0
UFO Moviez
Neutral
444
-
1,226
619
685
33.2
33.4
30.0
34.9
14.8
12.7
2.1
1.8
13.8
13.9
1.7
1.3
Visaka Industries
Neutral
197
-
313
1,051
1,138
10.3
10.4
21.0
23.1
9.4
8.5
25.3
23.7
9.0
9.2
0.6
0.5
VRL Logistics
Neutral
267
-
2,434
1,902
2,119
16.7
16.6
14.6
16.8
18.3
15.9
4.0
3.5
21.9
22.2
1.4
1.2
Wonderla Holidays
Neutral
328
-
1,854
287
355
38.0
40.0
11.3
14.2
29.0
23.1
4.2
3.6
21.4
23.9
6.1
5.0
Source: Company, Angel Research; Note: *December year end; #September year end; &October year end; Price as on November 28, 2016
Market Outlook
November 29, 2016
Research Team Tel: 022 - 39357800
DISCLAIMER
Angel Broking Private Limited (hereinafter referred to as “Angel”) is a registered Member of National Stock Exchange of India
Limited,Bombay Stock Exchange Limited and Metropolitan Stock Exchange Limited. It is also registered as a Depository Participant with
CDSL and Portfolio Manager with SEBI. It also has registration with AMFI as a Mutual Fund Distributor. Angel Broking Private Limited is a
registered entity with SEBI for Research Analyst in terms of SEBI (Research Analyst) Regulations, 2014 vide registration number
INH000000164. Angel or its associates has not been debarred/ suspended by SEBI or any other regulatory authority for accessing
/dealing in securities Market. Angel or its associates/analyst has not received any compensation / managed or
co-managed public offering of securities of the company covered by Analyst during the past twelve months.
This document is solely for the personal information of the recipient, and must not be singularly used as the basis of any investment
decision. Nothing in this document should be construed as investment or financial advice. Each recipient of this document should make
such investigations as they deem necessary to arrive at an independent evaluation of an investment in the securities of the companies
referred to in this document (including the merits and risks involved), and should consult their own advisors to determine the merits and
risks of such an investment.
Reports based on technical and derivative analysis center on studying charts of a stock's price movement, outstanding positions and
trading volume, as opposed to focusing on a company's fundamentals and, as such, may not match with a report on a company's
fundamentals. Investors are advised to refer the Fundamental and Technical Research Reports available on our website to evaluate the
contrary view, if any.
The information in this document has been printed on the basis of publicly available information, internal data and other reliable
sources believed to be true, but we do not represent that it is accurate or complete and it should not be relied on as such, as this
document is for general guidance only. Angel Broking Pvt. Limited or any of its affiliates/ group companies shall not be in any way
responsible for any loss or damage that may arise to any person from any inadvertent error in the information contained in this report.
Angel Broking Pvt. Limited has not independently verified all the information contained within this document. Accordingly, we cannot
testify, nor make any representation or warranty, express or implied, to the accuracy, contents or data contained within this document.
While Angel Broking Pvt. Limited endeavors to update on a reasonable basis the information discussed in this material, there may be
regulatory, compliance, or other reasons that prevent us from doing so.
This document is being supplied to you solely for your information, and its contents, information or data may not be reproduced,
redistributed or passed on, directly or indirectly.
Neither Angel Broking Pvt. Limited, nor its directors, employees or affiliates shall be liable for any loss or damage that may arise from
or in connection with the use of this information.